How the Presentation of Data Helps to Better Understand the Impacts Caused by Climate Change
Share
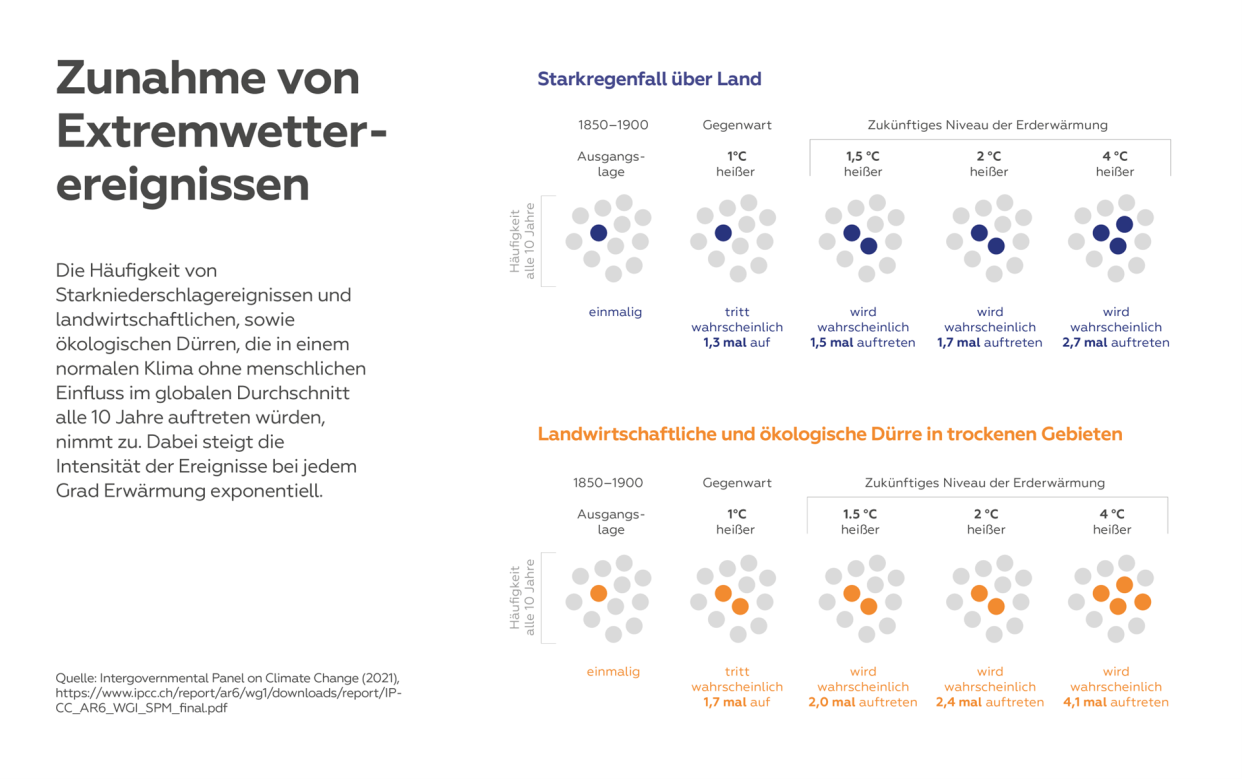
Ongoing climate change is escalating the occurrence and intensity of extreme weather events and natural disasters such as heavy rainfall and drought at a global level. The Intergovernmental Panel on Climate Change (IPCC) confirms this in its 2021 report (see infographic below). These increases are directly related to future emissions and the level of global warming associated with them. The frequency and intensity of extreme weather events have already risen at the current global average temperature, which as of 2023 was 1.1°C higher than the pre-industrial level from 1850 to 1900.
Therefore, as climate change progresses, there is a concrete need for political action to prevent security crises and protect affected groups of people. In addition to reducing emissions, local adaptation strategies must be supported and humanitarian aid provided in the event of a crisis. The IPCC’s first report in 1990 already mentions migration and human mobility as one of the potentially most serious consequences of climate change. Now, migration is also seen as an adaptation strategy that requires appropriate political support.
Challenges for Data Collection
To better develop political instruments and international aid, many international organizations are engaged in the procurement, compilation, and presentation of data on (inter)national migration. An example of this is the Global Compact for Safe, Orderly, and Regular Migration. Its primary objective is to collect and use accurate and disaggregated data as a basis for evidence-based action. However, this goal faces methodological challenges because neither a definition of the word migrant nor the legal basis and standards for data collection have been agreed upon worldwide. In the context of climate change, the different types of human mobility due to both slow and rapid environmental changes – including disaster displacement, planned relocation, trapped populations, and voluntary immobility – also make it difficult to collect data. In addition, mobility is a process that is based on various political, social, socioeconomic, or cultural factors and is thus not always exclusively attributable to changes in the climate
Climate Migration: Patterns and Data
It can be observed that human mobility in the context of climate change, insofar as resources and means are available, mainly takes place internally and interregionally, e.g., from the countryside to the city or from coastal areas to inland areas. Displacement due to natural disasters also often results in a return to the place of origin, and not all internally displaced persons remain internally displaced.
The largest comprehensive database on displacement due to natural disasters is provided by the Internal Displacement Monitoring Center (IDMC). Its data generation is based on information from national authorities, UN agencies, and non-governmental organizations. It includes data on internal displacement caused by conflicts and natural disasters starting in the year 2008.
The following interactive charts were created based on IDMC data on internal displacement that was filtered by weather-related natural disasters (floods, droughts, storms, etc.) to better illustrate the link between extreme weather events and human displacement.
The graph above shows global and country-specific data on internal displacement by type of natural disaster and the number of events reported between 2008 and 2022. Examples of countries and natural disasters can be selected individually.
In the second interactive chart above, the events are shown on a world map in absolute numbers and as a percentage of the population. Data from UNDESA is used for the population numbers.
High numbers of displacements are clearly visible, particularly due to storms, floods, and forest and wildfires in populous countries such as China, India, and the United States. However, if looking at internal displacement as a percentage of the population, these countries stand out less, and the impact on coastal regions in the Pacific and Caribbean, as well as on East Africa, becomes clearer.
The last chart above shows the countries according to the greatest impact. The total number of internally displaced persons due to natural disasters and the annual percentages for the period from 2008 to 2022 are added up. People can be affected by internal displacement several times within this period – for example if they were able to return after being displaced and were then displaced again. Thus, not 60 percent of the total population of Cuba but rather a total number of people corresponding to 60 percent of Cuba’s population was displaced by natural disasters in the years 2008 to 2022.
When looking at the percentages, small island developing states, the Philippines, and countries in East Africa are particularly affected. In addition, the total number of events leading to internal displacement varies by region; for example, on the island of St. Martin, a storm in 2017 led to 30 percent of the population having to leave their place of residence in the short or long term. The CLIMB database provides a breakdown of the policy instruments on human mobility in the context of disasters, climate change, and environmental degradation that are available to countries and regions.
This data and analysis highlight the urgent need to strengthen policy measures and international support to tackle the challenges of climate migration.